S&P500 Daily Action Areas & Price Targets 22/7/26

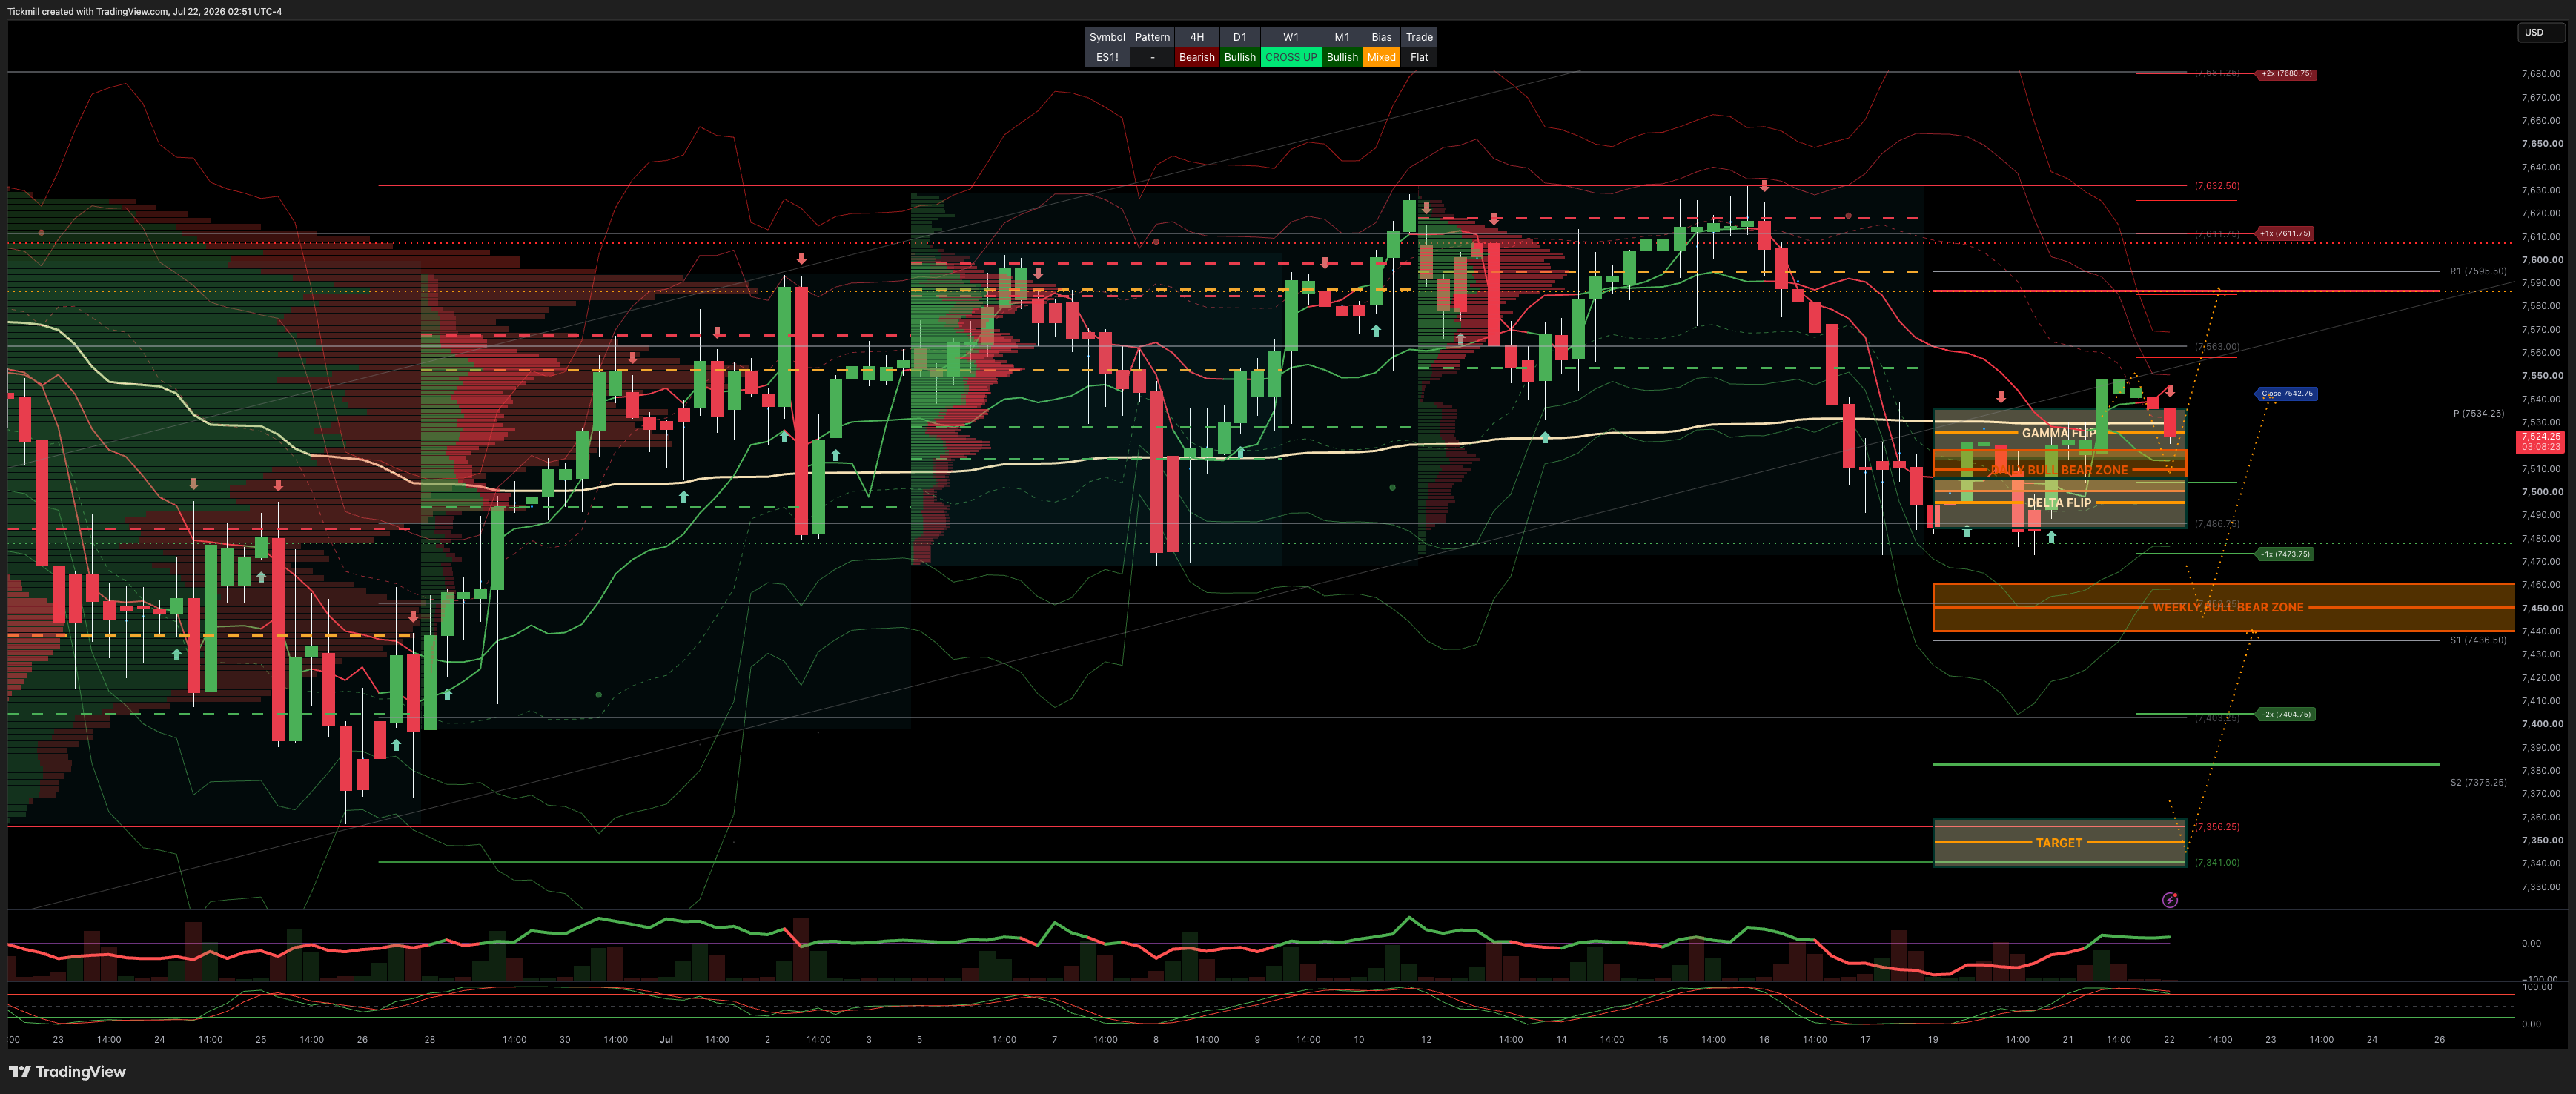
S&P500 Daily Action Areas & Price Targets 22/7/26
***QUOTING ES1! FOR CASH US500 EQUIVALENT LEVELS, SUBTRACT POINT DIFFERENCE***
WEEKLY BULL BEAR ZONE 7460/40
WEEKLY RANGE RES 7632 SUP 7358
MONTHLY RANGE RES 7838 SUP 7258
JHEQX Q3 Collar Short Call Cap: ~7,750 – 7,900 - Long Put Strike: ~7,050 – 7,100 (approx. 5% downside protection) Short Put Strike: ~5,950
DEC2025 OPEX to DEC2026 OPEX is 945 points giving us a range of [5889,7779]
SPX PUT/CALL RATIO 1.15 (The numbers reflect options traded during the current session.) A put-call ratio below 0.7 is generally considered bullish, and a put-call ratio above 1.0 is generally considered bearish.
GS Flow Desk: large S&P 31Aug 7000/7950 strangle in roughly $20mm vega / $115mm premium …My Read – classic “big convexity versus carry” trade: either someone paid a lot to own a wide August move, or someone got paid a lot to bet that the S&P stays comfortably inside the 7000–7950 corridor
DAILY VWAP BULLISH 7540
WEEKLY VWAP BEARISH 7563
MONTHLY VWAP BULLISH 7036
DAILY STRUCTURE - BALANCE 7627/7469
WEEKLY STRUCTURE - BALANCE 7648/7247
MONTHLY STRUCTURE - OTFH - 7247
Balance: This refers to a market condition where prices move within a defined range, reflecting uncertainty as participants await further market-generated information. Our approach to balance includes favouring fade trades at the range extremes (highs/lows) while preparing for potential breakout scenarios if the balance shifts.
One-Time Framing Higher (OTFH): This represents a market trend where each successive bar forms a higher low, signalling a strong and consistent upward movement.
One-Time Framing Lower (OTFL): This describes a market trend where each successive bar forms a lower high, indicating a pronounced and steady downward movement.
DAILY BULL BEAR ZONE 7500/7490
GAMMA FLIP 7526
DELTA FLIP 7495
DAILY RANGE RES 7610 SUP 7474
2 SIGMA RES 7679 SUP 7406
VIX BULL BEAR ZONE 17.4
TRADES & TARGETS
LONG ON REJECT/RECLAIM DAILY BULL/BEAR ZONE TARGET RTH CLOSE>7585
LONG ON REJECT/RECLAIM WEEKLY BULL/BEAR ZONE TARGET RTH CLOSE>DAILY BULL/BEAR ZONE
***ADDITIONAL SETUPS & TARGETS HIGHLIGHTED ON THE CHARTS***
(I FADE TESTS OF 2 SIGMA LEVELS ESPECIALLY INTO THE FINAL HOUR OF THE NY CASH SESSION AS 90% OF THE TIME WHEN TESTED THE MARKET WILL CLOSE ABOVE OR BELOW THESE LEVELS)
GOLDMAN SACHS FICC & EQUITIES TRADING DESK VIEWS
k/reward has improved after the forced de-risking.
The key nuance is that there were still no signs of chasing on the bounce. That is constructive. Relief rallies that occur without broad investor capitulation into upside often have more room because positioning has not immediately re-crowded.
AI / Semis — Bounce From Washed-Out Levels
The AI and semiconductor complex led the rebound. That is exactly where the pain had been concentrated, and the sharpness of the move reflects how much length had been reduced. When a crowded long trade has already been de-grossed and investors are underexposed, even modest stabilization can produce a violent snapback.
The current setup into GOOGL and TSLA earnings tomorrow is critical. If hyperscaler capex commentary is constructive, the AI trade could be re-underwritten higher. The market does not necessarily need a new acceleration in 2026 capex — those budgets are largely set — but it does need reassurance on 2027 planning, cloud demand, margins, and backlog.
For GOOGL in particular, the Street is already modeling a capex path of approximately:
Year | GOOGL Capex Estimate | Growth |
|---|---|---|
2026 | ~$186bn | +103% Y/Y |
2027 | ~$252bn | +35% Y/Y |
2028 | ~$270.3bn | +7% Y/Y |
If management simply reiterates this trajectory while showing strong cloud growth and margins, that may be enough to stabilize the narrative because the expected rate of increase is already slowing. If commentary implies a sharper slowdown or questions AI ROI, the relief rally could fade quickly.
Macro — Equity Rally Despite Higher Oil and Rates
The equity rally came despite a less-friendly macro backdrop. WTI is now near $85, and the 10-year yield is back above 4.62%. That combination matters because higher crude threatens the disinflation narrative and consumer margins, while higher yields pressure long-duration growth multiples.
For now, the market is looking through those macro pressures because the immediate driver is positioning. But the desk’s lack of chasing reflects the right caution: if rates and oil keep grinding higher, they can cap the upside even if AI sentiment improves.
The S&P also reclaimed distance from the short-term CTA pivot at 7,427. With the index closing at 7,509, the cushion is now roughly 82 points, or about 1.1%. That is a meaningful improvement from the prior close at 7,443, when the index was only around 16 points above the pivot.
Healthcare — DHR Pressure, LO Defense in Bioprocessing
Healthcare had its own idiosyncratic stress. DHR fell 13% after a 2Q miss and guide, with the company blaming several chromatography resin shipments that were expected in 2Q and 3Q but are now being pushed into next year. That hit bioprocessing pockets.
The healthcare desk saw long-only defense on moves lower in bioprocessing. That is notable because many parts of healthcare remain lightly positioned after a difficult stretch. Earlier, ABT had served as a positive catalyst for medtech re-engagement; DHR shows that healthcare remains highly stock-specific, with investors willing to defend washed-out areas but punishing guide-downs aggressively.
Derivatives — NDX Vol Outperforms With Spot
Derivatives reflected the tech-led nature of the rally. SPX and RUT fixed-strike vols were slightly offered in the front end and little changed further out, but NDX vol outperformed alongside spot, with the belly and backend of the curve catching a bid while skew relaxed. That is an important signal: NDX upside participation is being repriced, not just downside hedging.
The “AI losers” basket staged a meaningful relief rally, with GSTMTAIR outperforming SPXXAI by roughly 15% off the YTD lows. The desk thinks this rebound creates a more attractive entry point to revisit the short theme. Flows reflected that, with clients shorting GSTMTAIR outright or against GSTMTAIP, the US Broad AI basket.
This is a nuanced point. The desk likes buying the AI/momentum dip selectively, but not indiscriminately. The rebound in lower-quality or “AI loser” names may have gone far enough to make them attractive shorts again, particularly versus broader AI winners. In other words, own the cleaner AI winners / infrastructure beneficiaries, but fade the lower-quality catch-up.
In single-name and thematic options, clients re-engaged with AI winners primarily through DRAM short-term upside and select single names. There was also interest in structured exotic trades expressing views on correlation between semis and other sectors such as energy and commodities, consistent with the broader market’s focus on AI plus macro cross-currents.
Implied Range Projection
The SPX implied move through Thursday’s close is 0.77%. With the S&P closing at 7,509, that implies a move of roughly:
Implied SPX range through Thursday’s close: 7,451 to 7,567.
This is important for two reasons. First, the lower bound of 7,451 remains above the key short-term CTA pivot at 7,427, meaning the market is no longer pricing a normal move that breaches the near-term systematic trigger. Second, the upper bound of 7,567 would take the S&P back toward last week’s stabilization zone, but not decisively beyond the recent highs.
Key Levels
Level | Significance |
|---|---|
7,567 | Upper bound of implied range through Thursday close |
7,509 | Current SPX close |
7,451 | Lower bound of implied range through Thursday close |
7,427 | Short-term CTA pivot |
A break above 7,567 after GOOGL / TSLA would suggest the market is re-underwriting AI and earnings risk more broadly. A break below 7,451 would indicate the relief rally is failing. A break below 7,427 would be more concerning, as it could reintroduce systematic selling risk.
Disclaimer: The material provided is for information purposes only and should not be considered as investment advice. The views, information, or opinions expressed in the text belong solely to the author, and not to the author’s employer, organization, committee or other group or individual or company.
Past performance is not indicative of future results.
High Risk Warning: CFDs are complex instruments and come with a high risk of losing money rapidly due to leverage. 68% and 74% of retail investor accounts lose money when trading CFDs with Tickmill UK Ltd and Tickmill Europe Ltd respectively. You should consider whether you understand how CFDs work and whether you can afford to take the high risk of losing your money.
Futures and Options: Trading futures and options on margin carries a high degree of risk and may result in losses exceeding your initial investment. These products are not suitable for all investors. Ensure you fully understand the risks and take appropriate care to manage your risk.
Patrick has been involved in the financial markets for well over a decade as a self-educated professional trader and money manager. Flitting between the roles of market commentator, analyst and mentor, Patrick has improved the technical skills and psychological stance of literally hundreds of traders – coaching them to become savvy market operators!