S&P500 Daily Action Areas & Price Targets 11/6/26
S&P500 Daily Action Areas & Price Targets 11/6/26
***QUOTING ES1! FOR CASH US500 EQUIVALENT LEVELS, SUBTRACT POINT DIFFERENCE***
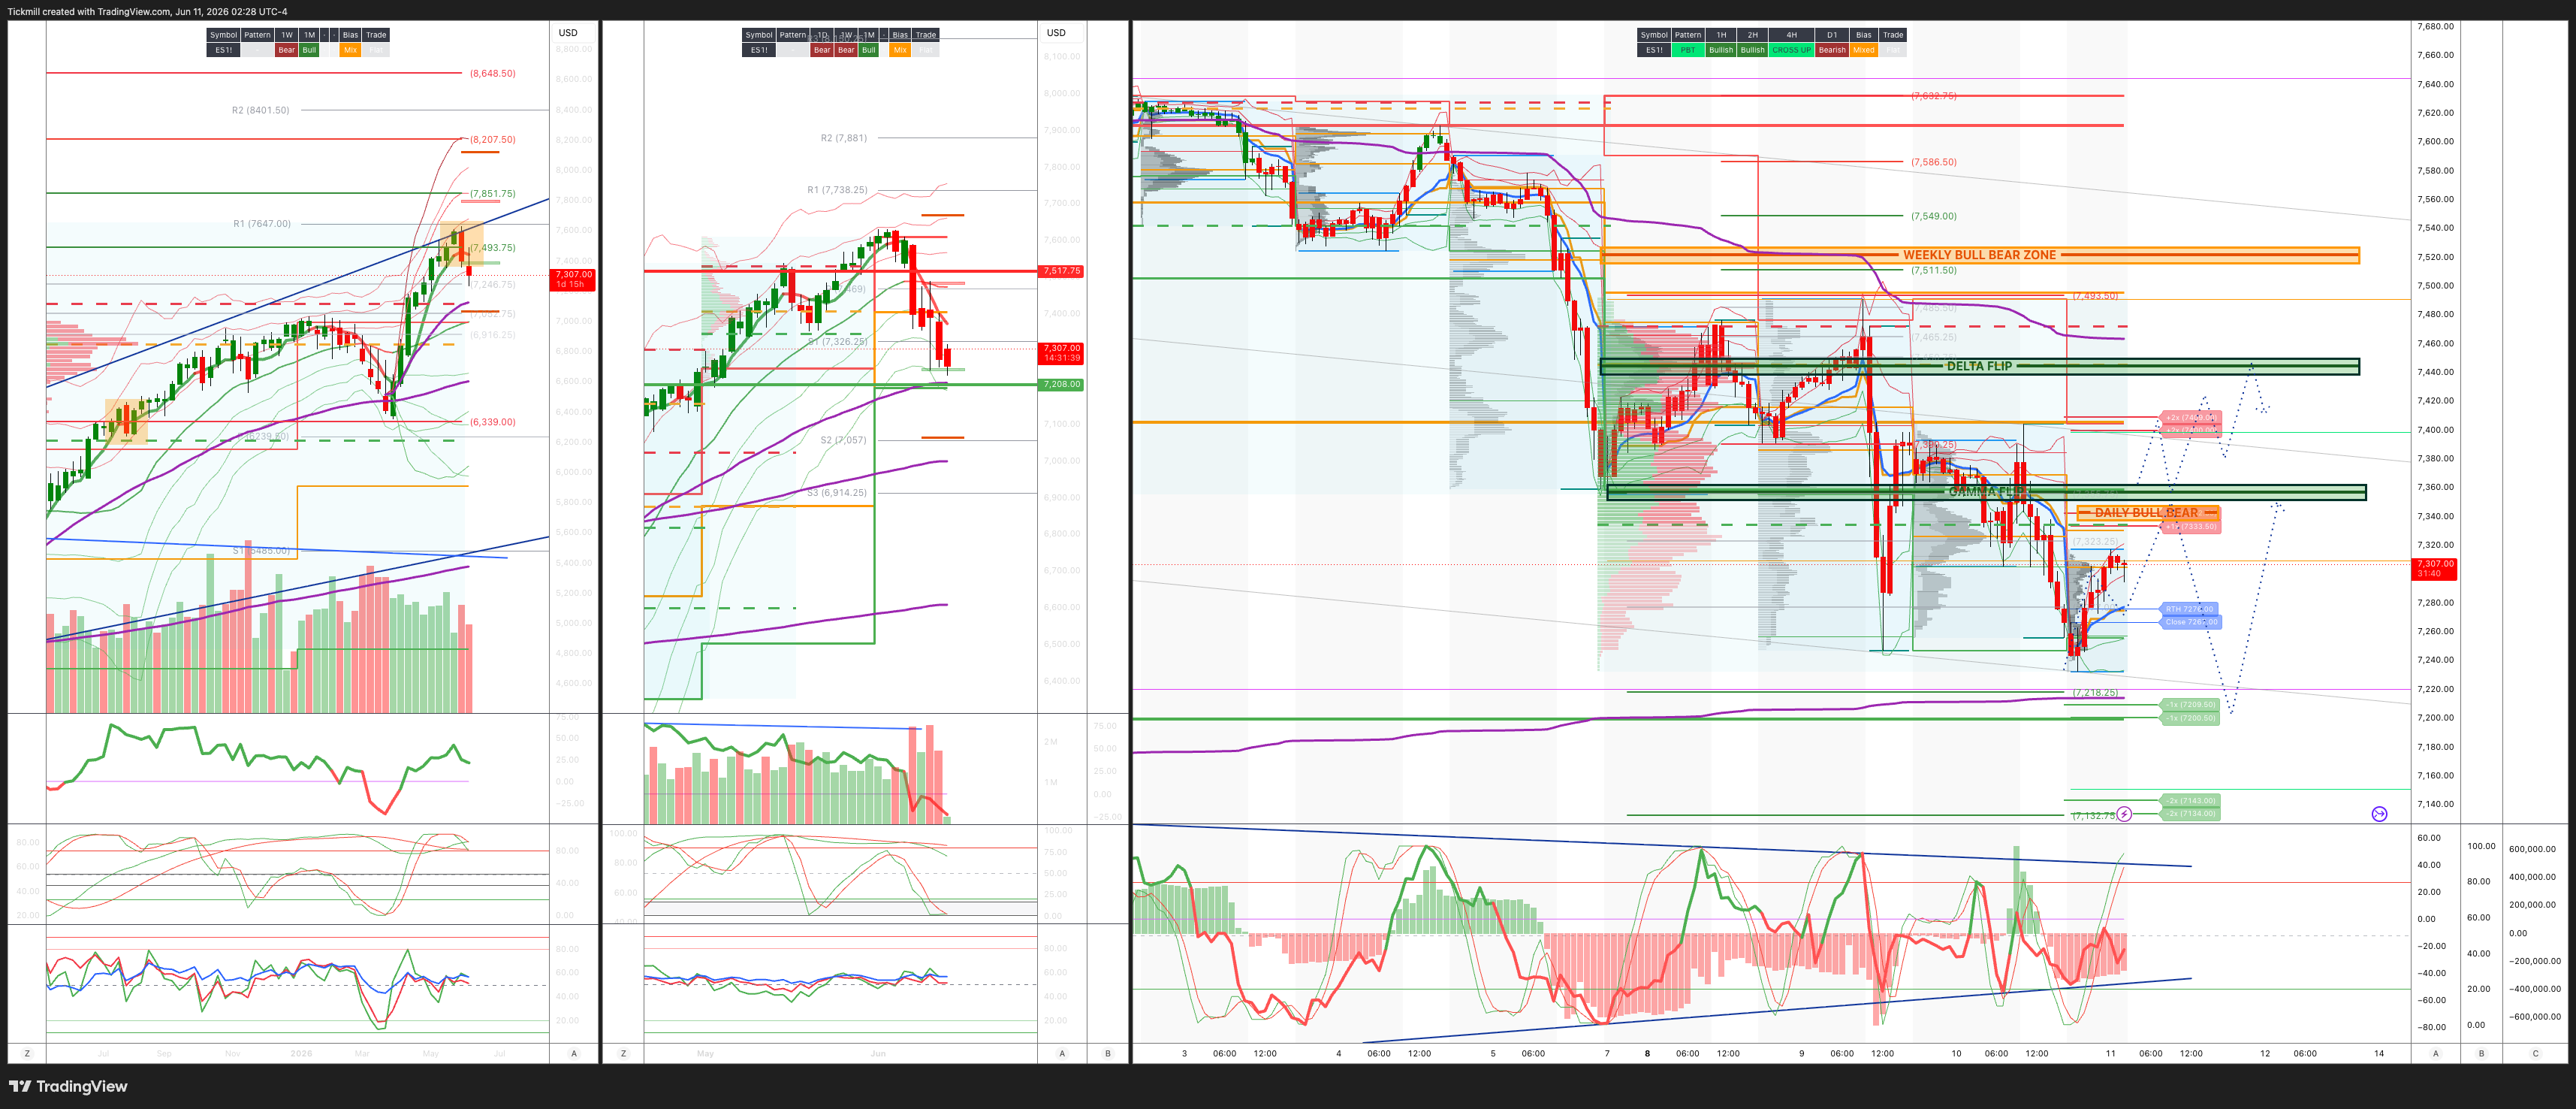
WEEKLY BULL BEAR ZONE 7515/25
WEEKLY RANGE RES 7517 SUP 7208
June MOPEX Straddle: 274pt range implies a OPEX to OPEX range of [7134, 7683]
June QOPEX Straddle is 546.4pt giving us a range of [5960,7052]
JHEQX Q2 Collar 6189/6290 - 6865/6955
DEC2025 OPEX to DEC2026 OPEX is 945 points giving us a range of [5889,7779]
SPX PUT/CALL RATIO 1.23 (The numbers reflect options traded during the current session. A put-call ratio below 0.7 is generally considered bullish, and a put-call ratio above 1.0 is generally considered bearish)
DAILY VWAP BEARISH 7370
WEEKLY VWAP BEARISH 7477
MONTHLY VWAP BULLISH 7036
DAILY STRUCTURE - OTFL 7404
WEEKLY STRUCTURE - TBC
MONTHLY STRUCTURE - OTFH - 7199
Balance: This refers to a market condition where prices move within a defined range, reflecting uncertainty as participants await further market-generated information. Our approach to balance includes favouring fade trades at the range extremes (highs/lows) while preparing for potential breakout scenarios if the balance shifts.
One-Time Framing Higher (OTFH): This represents a market trend where each successive bar forms a higher low, signalling a strong and consistent upward movement.
One-Time Framing Lower (OTFL): This describes a market trend where each successive bar forms a lower high, indicating a pronounced and steady downward movement.
DAILY BULL BEAR ZONE 7335/45
GAMMA FLIP 7361
DELTA FLIP 7513
DAILY RANGE RES 7335 SUP 7199
2 SIGMA RES 7403 SUP 7141
VIX BULL BEAR ZONE 19
TRADES & TARGETS
SHORT ON REJECT/RECLAIM DAILY BULL BEAR ZONE TARGET DAILY RANGE SUP
LONG ON REJECT/RECLAIM DAILY RANGE SUP TARGET DAILY BULL BEAR ZONE
***ADDITIONAL SETUPS & TARGETS HIGHLIGHTED ON THE CHARTS***
(I FADE TESTS OF 2 SIGMA LEVELS ESPECIALLY INTO THE FINAL HOUR OF THE NY CASH SESSION AS 90% OF THE TIME WHEN TESTED THE MARKET WILL CLOSE ABOVE OR BELOW THESE LEVELS)
GOLDMAN SACHS TRADING DESK VIEW - ‘Tech Unwind’
US Close: Tech-Led Drawdown Deepens Despite Benign CPI Optics
US equities sold off sharply, with the pressure again concentrated in Mega-Cap Tech, AI, and high-beta growth, while flows continued to show relative demand for Health Care, Financials, and Consumer Discretionary. The key message is that CPI was not bad enough to be the obvious reason for the selloff. Instead, the market is dealing with a positioning, liquidity, and AI-capex confidence problem at the same time that rates remain sticky and geopolitical uncertainty is unresolved.
The S&P 500 fell 162bps to 7,266, the Nasdaq 100 dropped 198bps to 28,508, the Russell 2000 lost 110bps to 2,835, and the Dow fell 187bps to 49,918. Volumes were elevated at 20.8bn shares across US exchanges versus a YTD daily average of 19.1bn, but single-stock activity was still described as relatively muted, suggesting that the selloff was not a classic high-conviction fundamental liquidation. It was more of a broad risk reduction and factor unwind.
The VIX jumped 1183bps to 22.22, showing that the volatility regime is now repricing. WTI crude fell 207bps to $90.03, though the desk noted oil trading near $92 amid another wave of geopolitical uncertainty. The 10-year yield rose to 4.5523%, the dollar was modestly firmer at 100.03, gold was nearly flat, and Bitcoin slipped slightly to $61,511.
1. The Drawdown Is Still Tech-Led
The defining feature remains Big Tech underperformance. Mag 7 fell roughly 2%, and NVDA declined 3.7%, closing below its 50-day moving average for the first time since April 8. It also traded near the psychologically important $200 level.
That matters because NVDA has been the market’s most important AI bellwether and one of the central funding / risk-on symbols of the cycle. A break below the 50-day does not automatically end the trend, but it can force systematic and discretionary reassessment, particularly after a massive run and extremely crowded exposure.
The broader point is that the market is not simply reacting to CPI. It is digesting a sequence of stressors:
AI / semiconductor positioning had become very crowded.
SOX and related hardware names were technically extended.
Memory and semi names have been giving back recent strength.
Crusoe data-center delay headlines raised questions about AI capex timing.
ORCL’s cloud guide was solid but did not clear the buyside whisper bar.
Liquidity has deteriorated sharply.
Buyback support is close to tapering as blackout approaches.
New issuance and potential large capital raises remain a liquidity concern.
This is why the unwind feels sharper than the macro data alone would suggest.
2. Breadth Rotation Still Exists, but Index Pressure Is Rising
Flows continue to show a broadening theme beneath the surface. Asset managers were net sellers overall, with supply concentrated in Tech, while demand showed up in Health Care, Financials, and Discretionary. Hedge funds were roughly flat, with a similar broadening pattern.
So the rotation trade is not dead. Investors are still trying to move capital away from crowded Tech and toward laggards or sectors with cleaner positioning. But the problem is that Tech and Mag 7 are so large that even a healthy broadening impulse cannot fully offset heavy selling in the biggest index weights.
This is the key transition: earlier in the week, equal-weight strength could mask cap-weight weakness. Now, the cap-weighted drawdown is becoming large enough that it is pulling the whole complex lower, including the Dow and Russell.
3. Liquidity Has Become a Major Issue
Liquidity has deteriorated sharply. S&P top-of-book depth is now at its lowest level since April 2025, around $3.3mm. That is a critical market-structure point.
When depth is this poor, prices can gap on relatively modest flow. It also means that hedging, dealer positioning, ETF trading, and systematic signals can have a larger price impact than usual. In a low-depth environment, the difference between “orderly rotation” and “air pocket” becomes very thin.
This helps explain why activity on the floor was only 4 out of 10, yet the index move was large. You do not need heavy activity to generate big price moves when liquidity is thin.
The desk finished -498bps to sell versus a 30-day average of -5bps, with asset-manager supply concentrated in Tech. That is a meaningful flow imbalance, especially in a deteriorating liquidity environment.
4. CTA Thresholds Are Now in Play
The market is now through the short-term S&P CTA threshold and roughly 3% from the medium-term threshold. This matters because systematic selling risk is starting to become more relevant.
Until now, systematic strategies were generally supportive because trend signals remained strong and volatility had been falling. But as spot declines and volatility rises, those signals can flip. The short-term threshold breach suggests some CTA supply may already be active or imminent. The medium-term threshold is more important because it can generate larger and more persistent de-risking if breached.
This does not mean a mechanical crash is guaranteed. But it does mean the market’s cushion has narrowed. If CPI aftermath, Fed pricing, geopolitical headlines, or AI capex concerns push the S&P another few percent lower, systematic selling could amplify the move.
5. CPI: Benign Headline, Less Comforting Composition
The broad read-through from CPI was relatively benign for the market, but not enough to create real relief. Core CPI came in a bit under consensus, which should have helped risk assets. However, the composition was firmer than economists expected.
The uncomfortable details were:
Shelter was warmer than expected.
Medical-care services were warmer than expected.
Transportation helped offset due to energy-price relief.
Inflation pricing has relaxed, but real yields have cheapened.
Solid activity data plus unresolved inflation pressure keep front-end pricing skewed toward hikes.
This is a tricky mix. The headline CPI number does not scream crisis, but the internal composition does not give the Fed enough confidence to relax. With activity data still solid, the market cannot easily price a dovish pivot. The likely outcome is that front-end rates remain biased toward hike risk or at least a longer restrictive stance.
For equities, the problem is not simply inflation. It is the combination of:
Sticky inflation components,
strong growth,
higher real yields,
rising rates volatility,
and crowded long-duration equity exposure.
That is a difficult backdrop for high-multiple Tech.
6. ORCL: Good, but Not Good Enough
Post-close, ORCL traded down about 2%. The company guided Q1 cloud revenue growth to +57–63% versus Street expectations around +57%, but buyside hopes were for a “6-handle.” It also confirmed its FY27 total revenue guide and plans a $40bn debt/equity raise in FY27.
This is highly relevant to the broader AI-capex debate. ORCL is delivering strong cloud growth, but the market wanted more. That is a sign of how high the bar has become across AI infrastructure and cloud. The planned capital raise also touches the market’s current liquidity concern: the AI buildout requires enormous financing, and investors are increasingly asking how much issuance the market can digest without pressuring existing winners.
The problem is not that ORCL’s guide was bad. The problem is that the market is in a phase where “good” may not be enough for AI-linked names with elevated expectations.
7. Derivatives: NDX Vol Outperforming, Factor Hedges More Important Than Index Hedges
In derivatives, flows were relatively quiet at the index level despite the large spot move. That is interesting because it suggests the selloff was not accompanied by full-blown panic hedging in broad index options.
Instead, hedging picked up more at the factor level than the index level. That matches the cash market: the stress is concentrated in Tech, AI, momentum, semis, and high-beta growth rather than evenly spread across the entire equity market.
NDX vol continues to significantly outperform S&P vol, which is exactly what one would expect in a Tech-led positioning flush. Investors are paying more to hedge Nasdaq exposure than broad S&P exposure.
The skew picture was nuanced:
Short-term S&P skew was crushed.
Skew continued to steepen further out on the curve.
Dealer gamma remains a challenge for a reversion.
The rest-of-week straddle went out at 1.57%.
This suggests near-term protection dynamics are messy, but investors are still willing to pay for medium-term downside or tail protection. The dealer gamma setup is also important. If dealers are short gamma or if the setup forces selling into weakness and buying into strength, intraday moves can become more exaggerated.
8. What Matters From Here
The catalysts over the next week and a half will likely determine whether this becomes a contained Tech correction or a broader market drawdown.
Key things to watch:
NVDA around $200 and the 50-day moving average
A quick reclaim would help stabilize the AI complex. Failure could invite more momentum and systematic selling.
S&P medium-term CTA threshold
The market is around 3% away. A breach would raise the risk of mechanical de-risking.
NDX vol versus SPX vol
Continued NDX vol outperformance confirms the unwind remains Tech-centered.
Liquidity / top-of-book depth
Poor depth means gaps are more likely and flows have outsized impact.
ORCL and AI capex financing reaction
The market’s response to large debt/equity raises will matter for the broader AI infrastructure complex.
Oil and geopolitical tripwires
Crude still has not exploded higher, but escalation into energy infrastructure or regime-change objectives would change the inflation-risk profile.
Buyback taper after mid-June
Corporate demand has been a major support. As blackout approaches, a 30% decline in flows could reduce the market’s shock absorbers.
This was a more concerning session than the prior Tech-led selloffs because the weakness broadened enough to pull down all major indices, volatility jumped meaningfully, liquidity deteriorated, and the S&P moved through short-term CTA thresholds. Still, the core issue remains positioning and liquidity in AI / Tech / momentum, not a wholesale rejection of equities.
CPI was benign on the surface but not clean enough to remove Fed or real-yield risk. ORCL’s post-close reaction shows the AI bar remains very high, and the planned capital raise reinforces concerns around funding the capex supercycle. Meanwhile, flows still show rotation into Health Care, Financials, and Discretionary, but that broadening cannot fully offset sustained selling in Mag 7 and semis.
The tactical stance remains: do not abandon the bull market, but respect the unwind. Stay with high-conviction liquid longs, rotate away from the most crowded high-velocity exposures where needed, and maintain downside convexity. The market is entering the part of the summer where thin liquidity, CTA thresholds, buyback tapering, and AI-capex uncertainty can turn ordinary pullbacks into air pockets.
Disclaimer: The material provided is for information purposes only and should not be considered as investment advice. The views, information, or opinions expressed in the text belong solely to the author, and not to the author’s employer, organization, committee or other group or individual or company.
Past performance is not indicative of future results.
High Risk Warning: CFDs are complex instruments and come with a high risk of losing money rapidly due to leverage. 71% and 74% of retail investor accounts lose money when trading CFDs with Tickmill UK Ltd and Tickmill Europe Ltd respectively. You should consider whether you understand how CFDs work and whether you can afford to take the high risk of losing your money.
Futures and Options: Trading futures and options on margin carries a high degree of risk and may result in losses exceeding your initial investment. These products are not suitable for all investors. Ensure you fully understand the risks and take appropriate care to manage your risk.
Patrick has been involved in the financial markets for well over a decade as a self-educated professional trader and money manager. Flitting between the roles of market commentator, analyst and mentor, Patrick has improved the technical skills and psychological stance of literally hundreds of traders – coaching them to become savvy market operators!