S&P500 Daily Action Areas & Price Targets 23/10/26
S&P500 Daily Action Areas & Price Targets 23/10/26
***QUOTING ES1!(Z CONTRACT LEVLES) FOR CASH US500 EQUIVALENT LEVELS, SUBTRACT POINT DIFFERENCE***
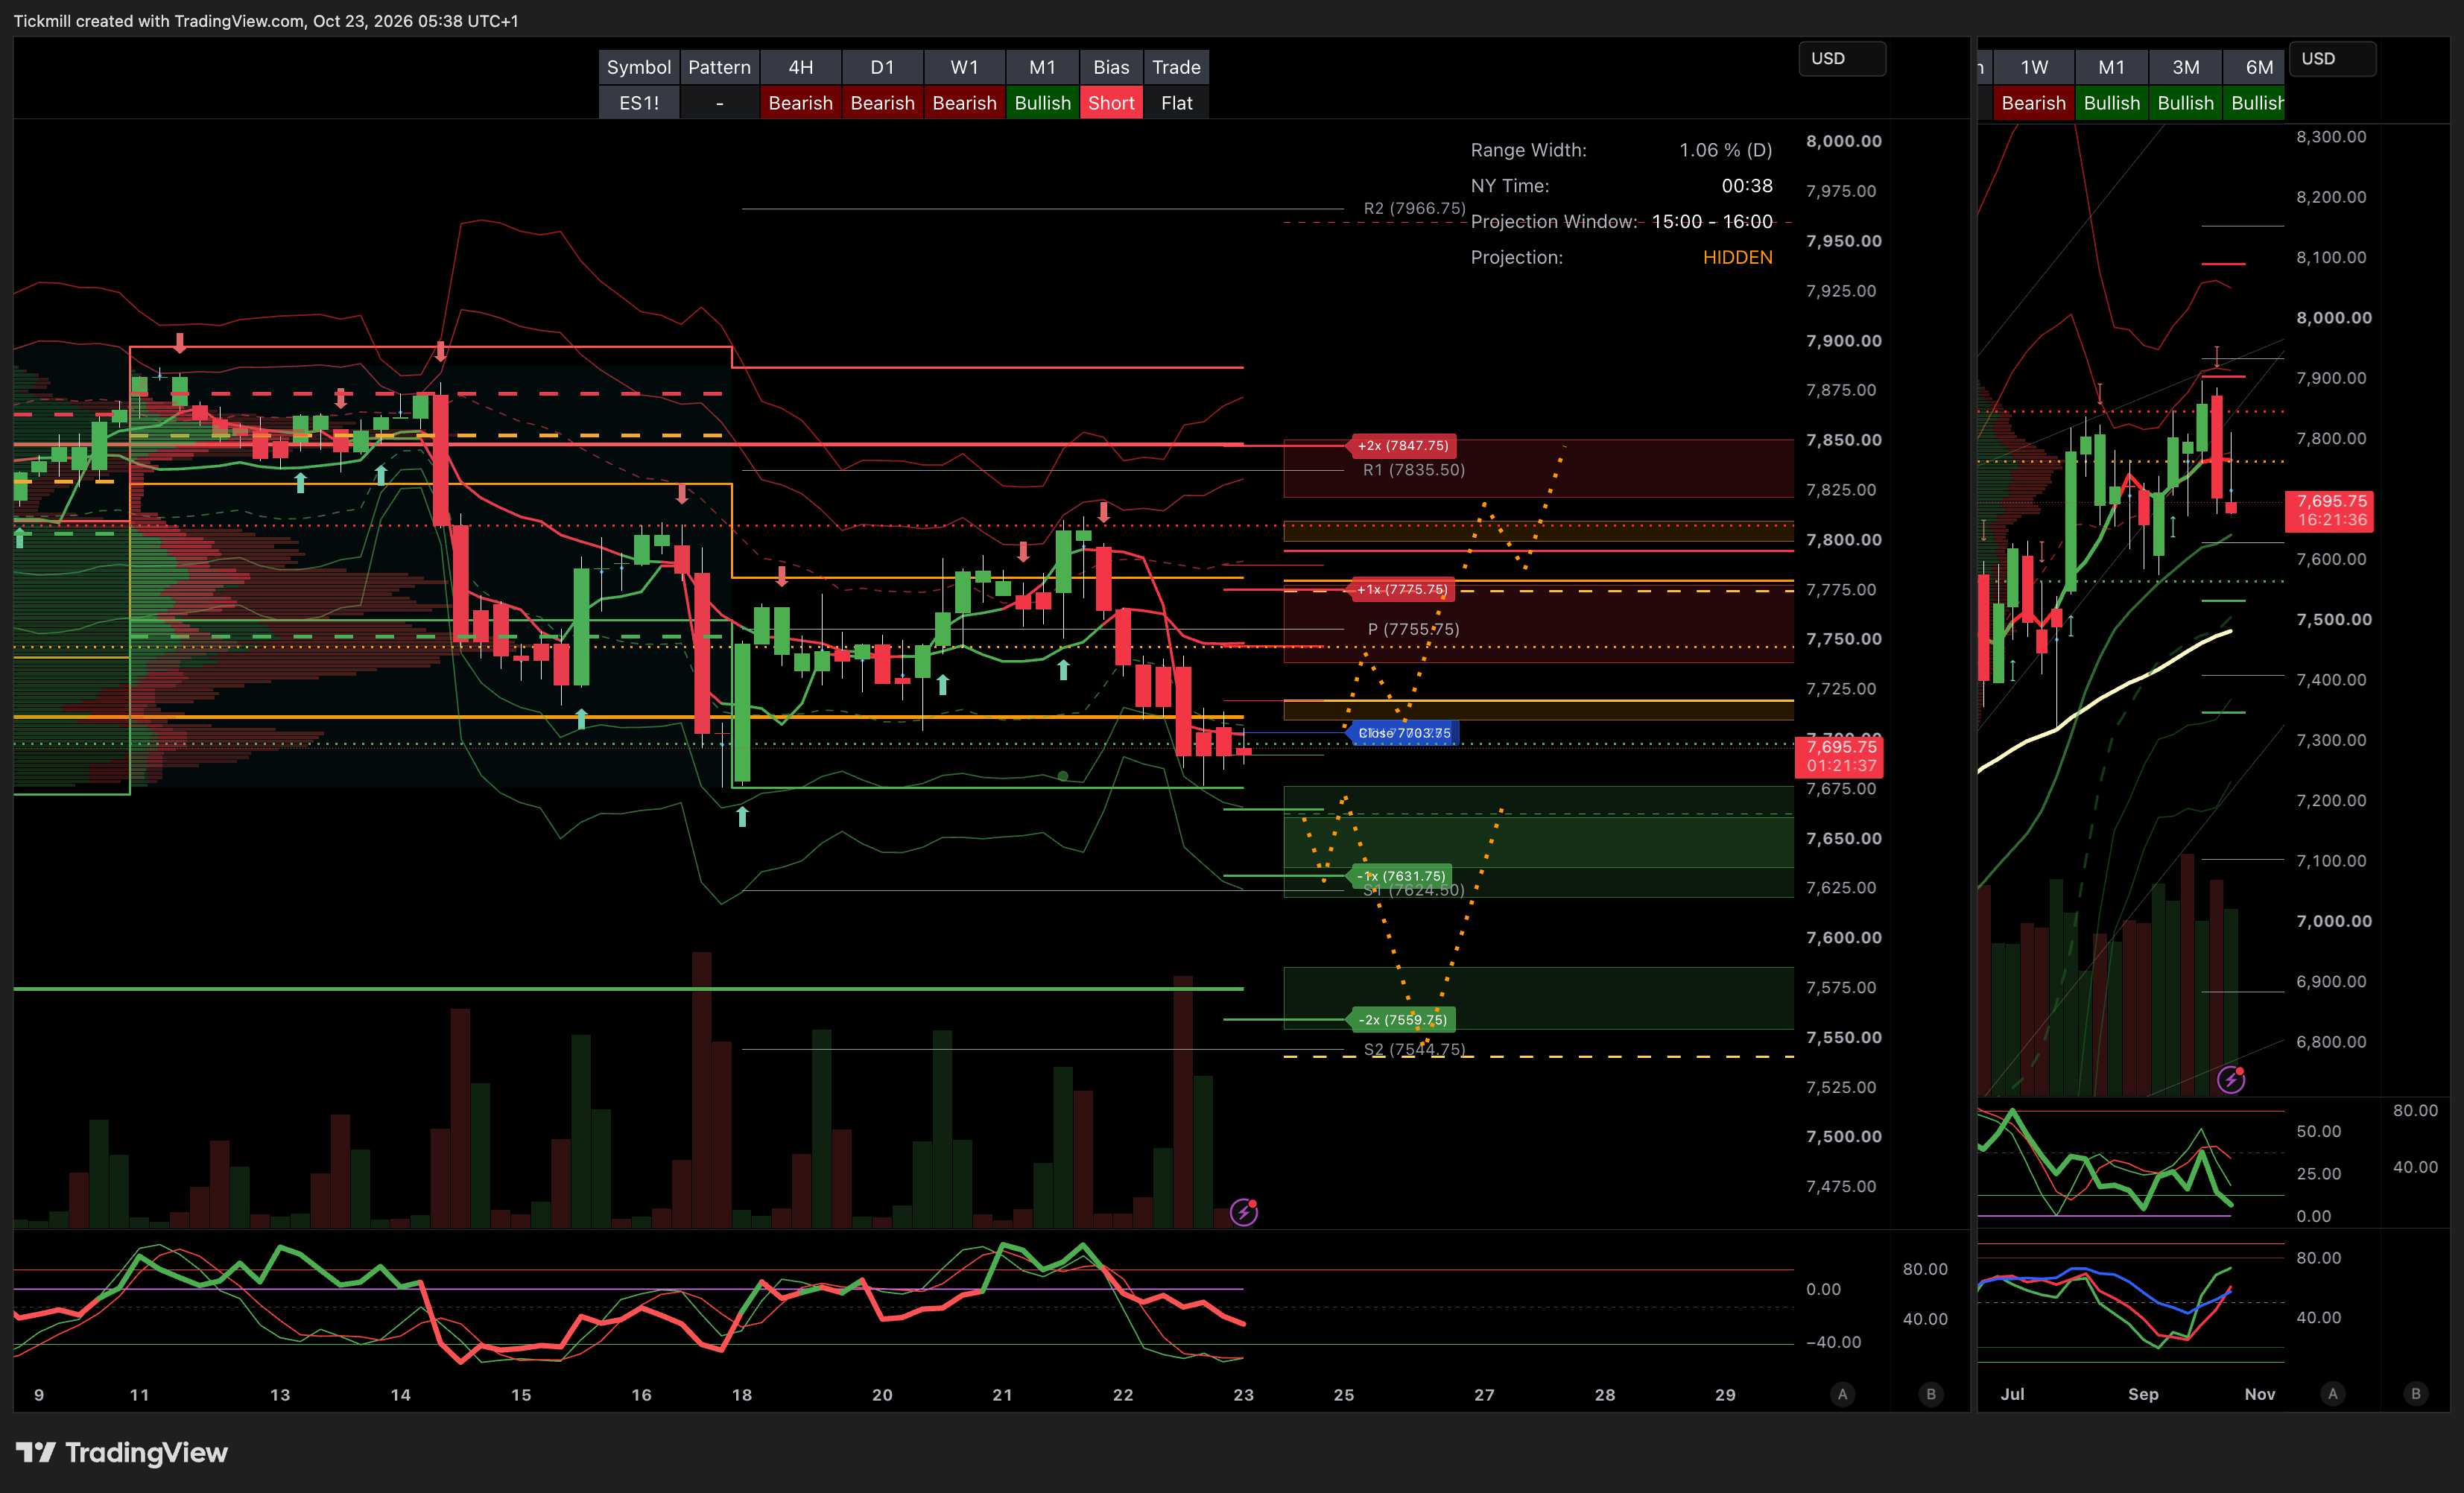
MONTHLY-WEEKLY& DAILY LEVELS
MONTHLY BULL BEAR ZONE 7440/7400
MONTHLY RANGE RES 7960 SUP 7663
WEEKLY BULL BEAR ZONE 7800/10
WEEKLY RANGE RES 7851/22 SUP 7555/86
DAILY BULL BEAR ZONE 7710/20
GLOBEX RANGE SUP 7661/21 RES 7739/78
GAMMA FLIP 7720
DELTA FLIP 7780
CALL WALLS 7795
PUT WALLS 7677/36
GAP FILL 7775/7541
DAILY STRUCTURE - BALANCE - 7676/7812
WEEKLY STRUCTURE - BALANCE - 7897/7575
MONTHLY STRUCTURE - OTFH - 7542
VIX BULL BEAR ZONE 18.72
VVIX-to-VIX The ratio of 5.67 compression is the main market driver, with the VVIX dropping more than the VIX, maintaining the ratio within the 5.0 to 6.0 range. This indicates a decrease in short-term tail risk insurance premiums, favouring volatility-selling strategies. Above 6.0 – 7.0+ signals higher risk and demand for options, reflecting market volatility concerns.
PRIMARY TRADES & TARGETS
ACCEPTANCE ABOVE DBBZ TARGET GAP FILL
***ADDITIONAL SETUPS & TARGETS HIGHLIGHTED ON THE CHARTS***
(I FADE TESTS OF 2 SIGMA LEVELS ESPECIALLY INTO THE FINAL HOUR OF THE NY CASH SESSION AS 90% OF THE TIME WHEN TESTED THE MARKET WILL CLOSE ABOVE OR BELOW THESE LEVELS)
SPX PUT/CALL RATIO 1.23 (The numbers reflect options traded during the current session.) A put-call ratio below 0.7 is generally considered bullish, and a put-call ratio above 1.0 is generally considered bearish.
JHEQX Upside cap (~7,920–7,950): Dealer gamma hedging at this call strike creates resistance, with market makers likely selling futures into strength and limiting volatility. Downside cushion (~7,270): If SPX drops 5% into Q4, long put gamma may force dealers to buy futures as the index falls, helping stabilize prices. Expiration: December 31, 2026. Strong pinning effects are likely near key strikes into year-end expiration.
DEC2025 OPEX to DEC2026 OPEX is 945 points giving us a range of [5889,7779]
Notes On Structure Implications
Balance: This refers to a market condition where prices move within a defined range, reflecting uncertainty as participants await further market-generated information. Our approach to balance includes favouring fade trades at the range extremes (highs/lows) while preparing for potential breakout scenarios if the balance shifts.
One-Time Framing Higher (OTFH): This represents a market trend where each successive bar forms a higher low, signalling a strong and consistent upward movement.
One-Time Framing Lower (OTFL): This describes a market trend where each successive bar forms a lower high, indicating a pronounced and steady downward movement.
GOLDMAN SACHS FICC & EQUITY TRADING DESK VIEWS
THE TAKE: ACUTE HEDGE FUND DRAWDOWN & BREADTH-INDEX DISCONNECT
US equity markets experienced an exceptionally intense under-the-hood risk-off session. For the first time since the March 2020 COVID shock, all three major hedge fund style cohorts dropped by more than -1.0% in a single session: Fundamental Long/Short (-1.1%), Systematics (-1.2%), and Multi-Strategists (-1.4%). The GS Hedge Fund Positioning Pair (GSTHVIPP) plummeted -4.2%—its worst single-day move since 2011—extending its MTD decline to -10.4% as crowded long unwinds in Tech accelerated.
Despite the index-level pressure, internal market dispersion hit historic extremes: 155 S&P 500 constituents registered moves of $\ge 2.0\sigma$ (the highest count since the May 2025 US-China tariff truce). Concurrently, 335 S&P 500 names finished green on the day, marking one of the widest spreads between underlying market breadth and negative headline index performance since the 1990s.
KEY PERFORMANCE, RATES & THEMATIC DYNAMICS
10-Year Treasury Yield Rally: US 10-Year yields plunged by ~15 bps—the largest single-day yield decline since August 2025—as AI growth concerns drove investors into duration assets. As desk strategists noted: "The very thing creating the equity problem is helping solve the rates problem." The 10Y yield closed below the CTA short-term threshold, triggering additional systematic bond-buying projections.
AI Basket Drawdown & High Beta Momentum:
The GS Pure AI Basket (
GSTMTAIP) sits -23% below its June peak, matching the magnitude of the pullback observed prior to the July bounce.High Beta Momentum (
GSPRHIMO) has completely erased its YTD gains. Historically, momentum drawdowns of this scale have provided attractive entry points.
SPX ex-AI (
SPXXAI) Outperformance: S&P 500 ex-AI has outperformed the market-cap S&P 500 by +6.0% MTD, closing its relative performance gap as 45% of S&P constituents exhibit negative beta to the benchmark.
INSTITUTIONAL FLOWS & EARNINGS WATCHLIST
Execution Floor Activity (9.6% Net Supply): Floor flows finished 9.6% better for sale overall, with zero offensive buying detected in AI themes.
Asset Managers (LOs): Finished ~20% better for sale, driven by concentrated supply in large-cap tech equities and index ETFs.
Hedge Funds (HFs): Finished 10% better for sale, led by long/short unwinds in semiconductors and hardware, alongside accelerated ETF short additions (2:1 short-to-long ratio).
Earnings Focus Shift: Following mixed post-earnings reactions in Meta (
META) and Lam Research (LRCX), attention turned to Western Digital (WDC, +2% AH) ahead of next week's heavy megacap reporting wave.
Disclaimer: The material provided is for information purposes only and should not be considered as investment advice. The views, information, or opinions expressed in the text belong solely to the author, and not to the author’s employer, organization, committee or other group or individual or company.
Past performance is not indicative of future results.
High Risk Warning: CFDs are complex instruments and come with a high risk of losing money rapidly due to leverage. 68% and 74% of retail investor accounts lose money when trading CFDs with Tickmill UK Ltd and Tickmill Europe Ltd respectively. You should consider whether you understand how CFDs work and whether you can afford to take the high risk of losing your money.
Futures and Options: Trading futures and options on margin carries a high degree of risk and may result in losses exceeding your initial investment. These products are not suitable for all investors. Ensure you fully understand the risks and take appropriate care to manage your risk.
Patrick has been involved in the financial markets for well over a decade as a self-educated professional trader and money manager. Flitting between the roles of market commentator, analyst and mentor, Patrick has improved the technical skills and psychological stance of literally hundreds of traders – coaching them to become savvy market operators!