S&P500 Trading Update 30/4/26
S&P500 Trading Update 30/4/26
***QUOTING ES1! FOR CASH US500 EQUIVALENT LEVELS, SUBTRACT POINT DIFFERENCE***
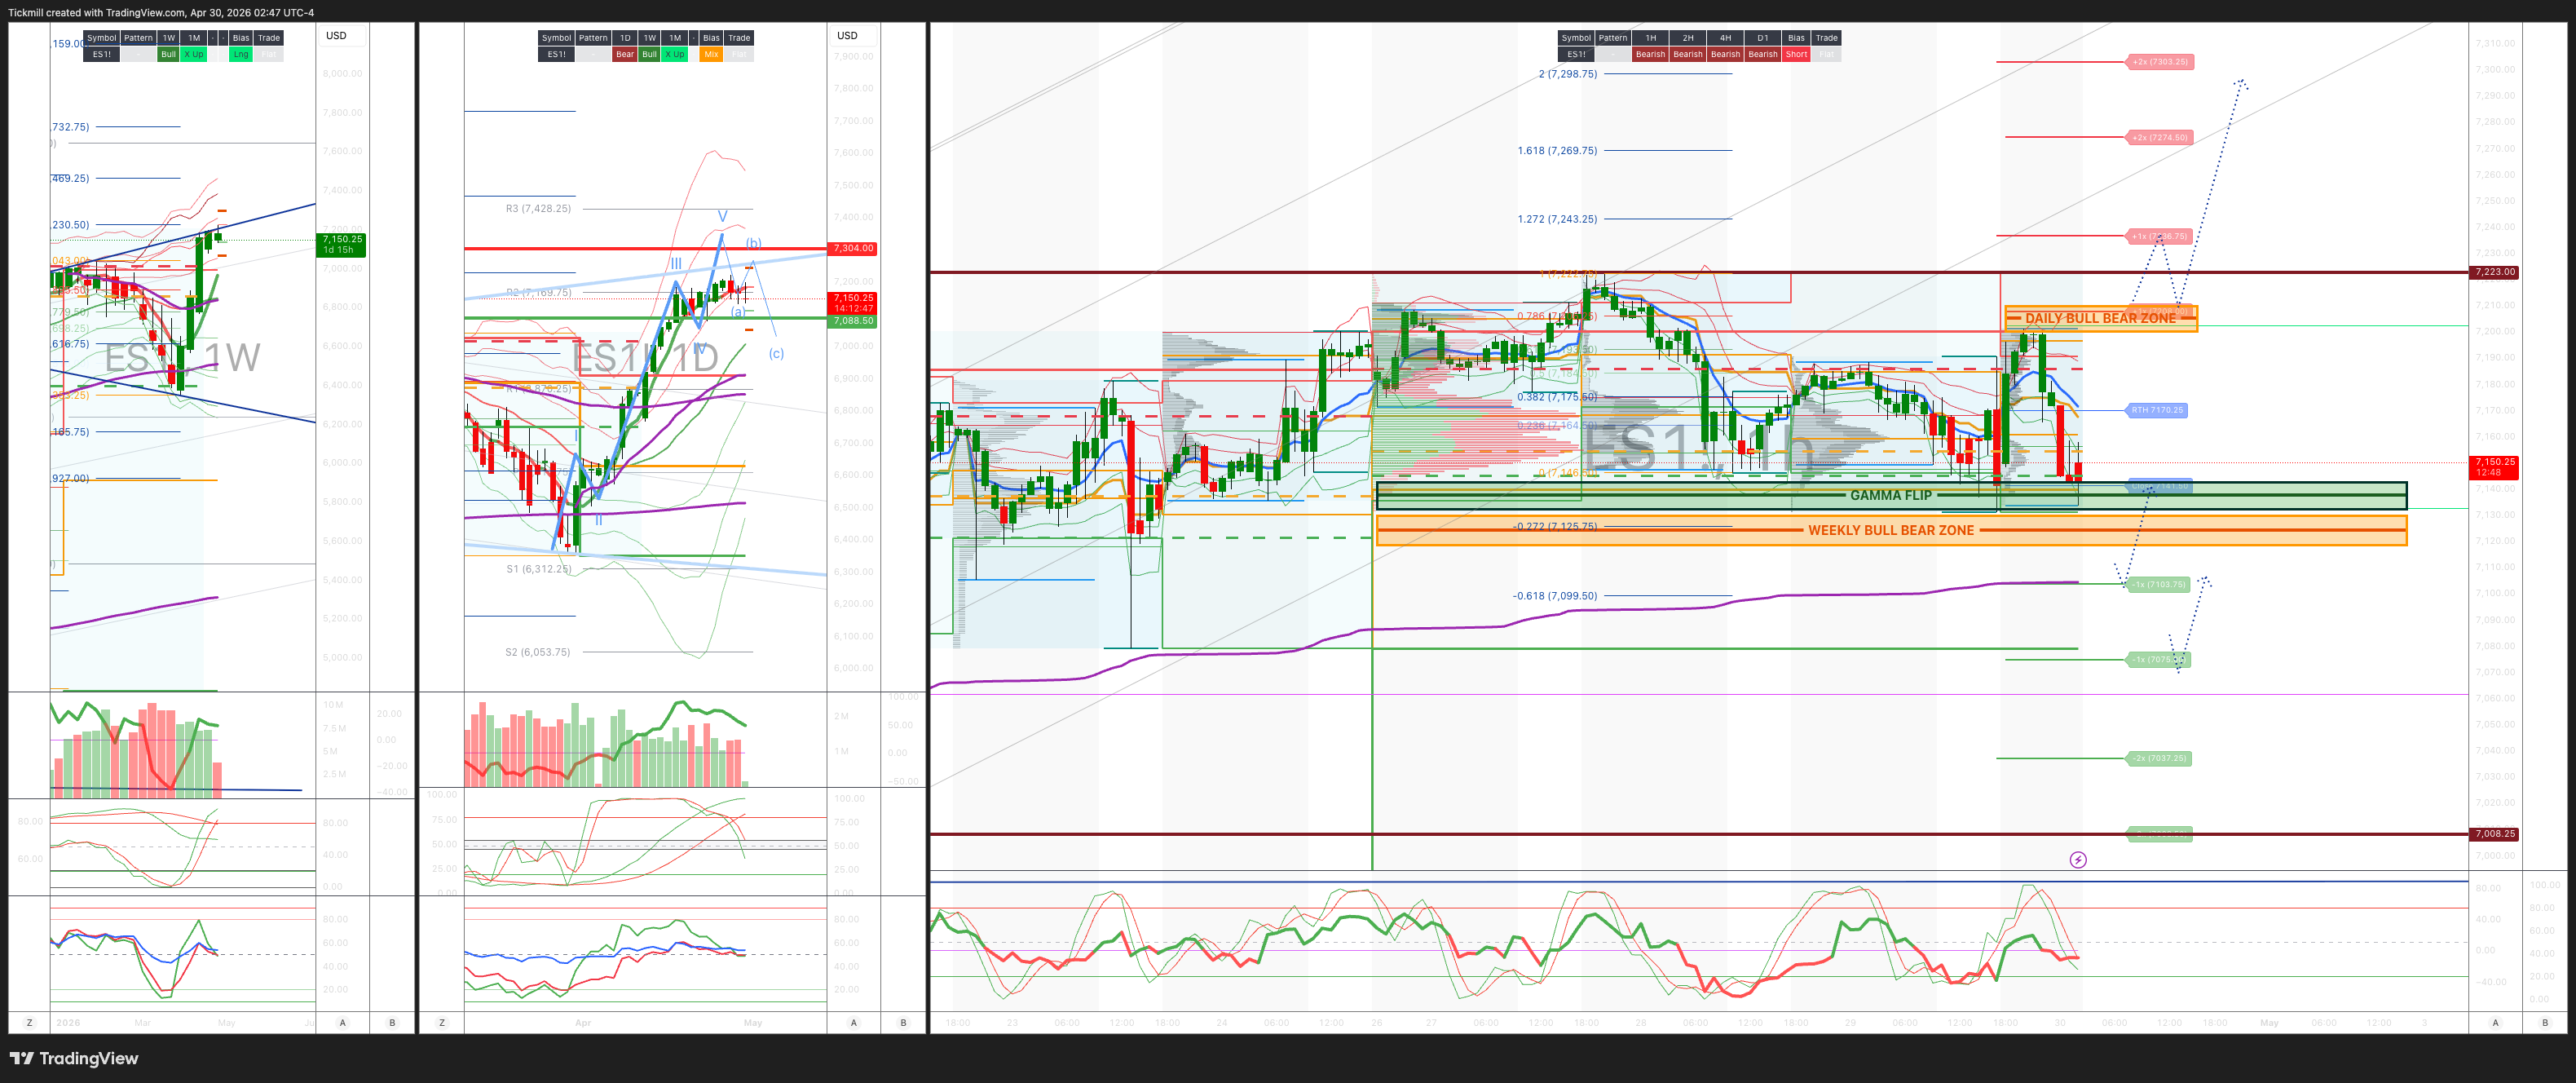
WEEKLY BULL BEAR ZONE 7130/20
WEEKLY RANGE RES 7304 SUP 7087
May OPEX Straddle: 225pt range implies a OPEX to OPEX range of [6900, 7350]
June QOPEX Straddle is 546.4pt giving us a range of [5960,7052]
JHEQX Q2 Collar 6189/6290 - 6865/6955
DEC2025 OPEX to DEC2026 OPEX is 945 points giving us a range of [5889,7779]
SPX PUT/CALL RATIO 1.18 (The numbers reflect options traded during the current session. A put-call ratio below 0.7 is generally considered bullish, and a put-call ratio above 1.0 is generally considered bearish)
DAILY VWAP BEARISH 7183
WEEKLY VWAP BULLISH 6819
MONTHLY VWAP BULLISH 6815
DAILY STRUCTURE – BALANCE - 7211/7079
WEEKLY STRUCTURE – OTFH - 7079
MONTHLY STRUCTURE - BALANCE
Balance: This refers to a market condition where prices move within a defined range, reflecting uncertainty as participants await further market-generated information. Our approach to balance includes favouring fade trades at the range extremes (highs/lows) while preparing for potential breakout scenarios if the balance shifts.
One-Time Framing Higher (OTFH): This represents a market trend where each successive bar forms a higher low, signalling a strong and consistent upward movement.
One-Time Framing Down (OTFD): This describes a market trend where each successive bar forms a lower high, indicating a pronounced and steady downward movement.
DAILY BULL BEAR ZONE 7200/10
GAMMA FLIP 7138
DELTA FLIP 6881
DAILY RANGE RES 7239 SUP 7106
2 SIGMA RES 7305SUP 7039
VIX BULL BEAR ZONE 19.5
TRADES & TARGETS
LONG ON ACCEPTANCE ABOVE DAILY BULL BEAR ZONE TARGET DAILY > WEEKLY RANGE RES
***ADDITIONAL SETUPS & TARGETS HIGHLIGHTED ON THE CHARTS***
(I FADE TESTS OF 2 SIGMA LEVELS ESPECIALLY INTO THE FINAL HOUR OF THE NY CASH SESSION AS 90% OF THE TIME WHEN TESTED THE MARKET WILL CLOSE ABOVE OR BELOW THESE LEVELS)
GOLDMAN SACHS TRADING DESK VIEW - ‘Megacap Mania’
## US Market Wrap — Oil Shock Caps Risk / Megacap Earnings
US equities were mixed and rangebound ahead of the FOMC decision and megacap earnings, with the S&P 500 -4bps to 7,136, NDX +58bps to 27,187, R2K -60bps to 2,739, and the Dow -57bps to 48,862. Volumes remained light at 16.4bn shares versus a 19.4bn YTD daily average, and the close saw a $1bn MOC sell imbalance. The key macro headwind was the renewed energy shock: WTI +8.2% to $108.07, with Brent +7% toward $119/bbl after reports that President Trump will maintain the Strait of Hormuz blockade. That pushed 10Y yields +7bps to 4.41%, lifted DXY +31bps to 98.95, and kept risk appetite contained despite pockets of single-stock strength. VIX rose 2.6 vols to 18.3, while gold fell 1% to $4,551 and Bitcoin slipped 1.2% to $75,574.
The Fed held the funds target range unchanged at 3.50–3.75%, as expected, but the statement leaned modestly more inflation-aware. The Committee changed its inflation language to say inflation “is elevated”, versus “remains somewhat elevated” previously, explicitly reflecting the oil-price impulse. The March easing bias was retained, though with a notable split: Hammack, Kashkari and Logan dissented against the easing-bias language, while Governor Miran dissented in favor of a 25bp cut. The read-through is that the Fed is still reluctant to abandon its easing framework, but the energy shock is making the path less clean and potentially limiting the scope for near-term dovish validation.
## Tape Tone — Dispersion, Not De-Risking
The session was more about dispersion than broad liquidation. Visa +8% and Mastercard +3.5% materially outperformed after Visa earnings, while money-center banks lagged by roughly 60bps, highlighting the familiar negative correlation between networks and banks as they compete for capital within financials. Feedback on Visa was constructive, with investors arguing the company is converting “potential headwinds” into “tailwinds.”
Activity was moderate, with the floor at 5/10. Asset-manager flows were broadly benign: small supply in materials and consumer discretionary was offset by demand in technology and energy. Hedge funds were also relatively balanced, with modest supply in macro products offset by demand in financials and materials. The lack of aggressive selling is important: even with oil up sharply and yields higher, positioning activity did not suggest a disorderly risk unwind.
## Derivatives — Hedges Added Into the Event Stack
Derivatives activity picked up as investors hedged into the combined FOMC / megacap earnings event risk. The desk saw strong demand for QQQ and SPY puts and put spreads, concentrated out to end-week and end-May maturities. With dealers long downside gamma, SPX vol stayed firm rather than exploding on the moderate spot weakness, and drifted slightly higher into the close. Skew steepened across the curve, particularly at the front end.
NDX showed both spot and vol outperformance, with front-end skew bid while longer-dated skew relaxed. The desk view is that front-end NDX vol looks rich, and prefers owning S&P vol over NDX or RTY. It also favors short S&P skew expressions in 6m–1y tenors. At the bell, the SPY ATM straddle priced an additional roughly 40bp post-close move.
## Megacap Tech After the Bell — Capex Broadly Down the Fairway
Initial megacap capex datapoints were largely in line with expectations, though still massive in absolute terms and central to the AI infrastructure debate:
- META: Upside capex surprise, raising FY guidance by roughly $10bn to $125–145bn, versus prior $115–135bn. Q1 capex was around $20bn.
- GOOGL: No explicit update to FY capex guide, currently $175–185bn. Q1 PP&E capex was around $36bn.
- MSFT: Calendar Q1 capex around $32bn, including capitalized leases. Focus shifts to FY27 capex trajectory commentary on the call.
- AMZN: Q1 capex $44.2bn, up 77% y/y, versus consensus of $43.4bn. No PR update to FY guide, currently around $200bn.
The early read is that capex remains elevated but not yet disorderly versus expectations. The key for the tape is whether investors view AI spend as still translating into durable revenue acceleration, or whether the market begins to penalize the scale and duration of investment.
## Bottom Line
The market held together reasonably well considering the scale of the oil move, the backup in yields, and the event-risk wall. But the setup is more fragile than the index close suggests. The Fed is now explicitly acknowledging elevated inflation pressure from oil, while megacap tech must prove that AI-led growth can justify another leg higher despite already-heavy positioning and enormous capex commitments. For now, this remains a dispersion tape rather than a panic tape — but with Brent near $119, 10Y yields back above 4.40%, and vol/skew firming into earnings, the burden of proof has shifted back to the generals.
Disclaimer: The material provided is for information purposes only and should not be considered as investment advice. The views, information, or opinions expressed in the text belong solely to the author, and not to the author’s employer, organization, committee or other group or individual or company.
Past performance is not indicative of future results.
High Risk Warning: CFDs are complex instruments and come with a high risk of losing money rapidly due to leverage. 69% and 73% of retail investor accounts lose money when trading CFDs with Tickmill UK Ltd and Tickmill Europe Ltd respectively. You should consider whether you understand how CFDs work and whether you can afford to take the high risk of losing your money.
Futures and Options: Trading futures and options on margin carries a high degree of risk and may result in losses exceeding your initial investment. These products are not suitable for all investors. Ensure you fully understand the risks and take appropriate care to manage your risk.
Patrick has been involved in the financial markets for well over a decade as a self-educated professional trader and money manager. Flitting between the roles of market commentator, analyst and mentor, Patrick has improved the technical skills and psychological stance of literally hundreds of traders – coaching them to become savvy market operators!